More about the CellKb platform
Latest Blog Posts
Deep dives into methods and comparisons
Expert Webinars
Live sessions and tutorials on CellKb features
Use Cases
Real-world applications and success stories
More about the CellKb platform
Latest Blog Posts
Deep dives into cell type annotation methods and comparisons
Expert Webinars
Live sessions and tutorials on CellKb features
Use Cases
Real-world applications and success stories
More about the CellKb platform
Blog Posts
Webinars
Use Cases
More about the CellKb platform
Please cite CellKb with a link to https://www.cellkb.com.
CellKb Immune: a manually curated database of mammalian hematopoietic marker gene sets for rapid cell type identification. Ajay Patil & Ashwini Patil, bioRxiv 2020.12.01.389890, 2020. doi: 10.1101/2020.12.01.389890
Towards reproducible cell type annotations
Why annotation quality in published single-cell studies falls short and what we can do about it.
Traditional and AI annotation methods
How AI cell type annotation methods compare to traditional approaches and what makes CellKb unique.
Granular cell type annotations with CellKb
Predicting granular cell types in the Tabula Muris Senis mouse liver single-cell dataset and comparing with CellTypist.
Cell type prediction using CellKb
Annotating individual cells in the PBMC dataset with CellKb and comparing with SingleR.
Cluster annotation with CellKb
Cell type annotation of clusters in PBMC single-cell RNA-seq data and how it compares with SingleR and PanglaoDB.
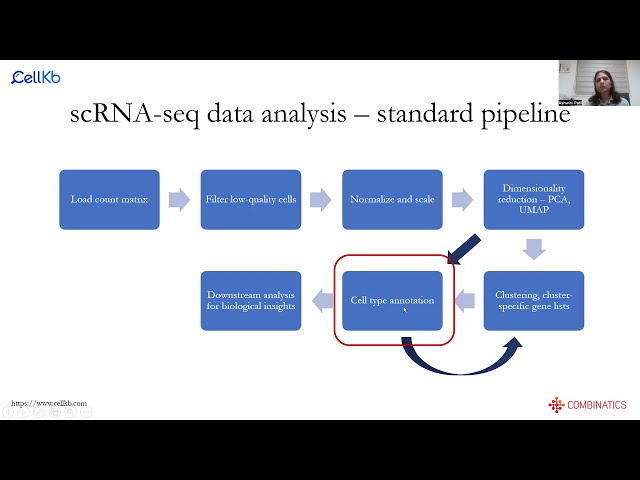
scRNA-seq data analysis and cell type annotation using CellKb
Webinar hosted by the Single-cell Immunophenotyping Core at the University of Chicago on the basics of scRNA-seq data analysis followed by cell type annotation with CellKb.
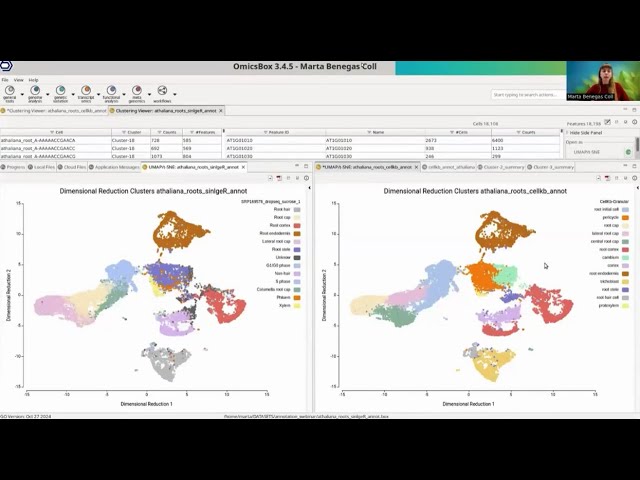
Cell type prediction using CellKb in BioBam OmicsBox
Webinar hosted by BioBam on the integration of CellKb within OmicsBox. Cluster annotation can now be performed in OmicsBox by directly calling the CellKb API.

Best of Show award for CellKb
CellKb won the Best of Show Award at Bio-IT World Expo 2024 in Boston. Our CEO talks about what makes CellKb a standout solution for cell type annotation and biomarker discovery.
Overview
Cell type prediction for 500,000 spots in custom whole mouse spatial RNA-seq data.
Challenge
Solution
Overview
Absence of a suitable reference database for annotating cell types in non-model organisms.
Challenge
Solution
Overview
Replacing broad cell type annotations with granular cell types using a comprehensive reference.
Challenge
Solution
Overview
Confirming cell type predictions made by AI methods.
Challenge
Solution
Start annotating your single-cell data with confidence